Posts
HistropediaJS 1.5.0 – charts, date bounds, and more predictable state changes
Previous release: HistropediaJS v1.4.0 · Next release: HistropediaJS v1.6.0
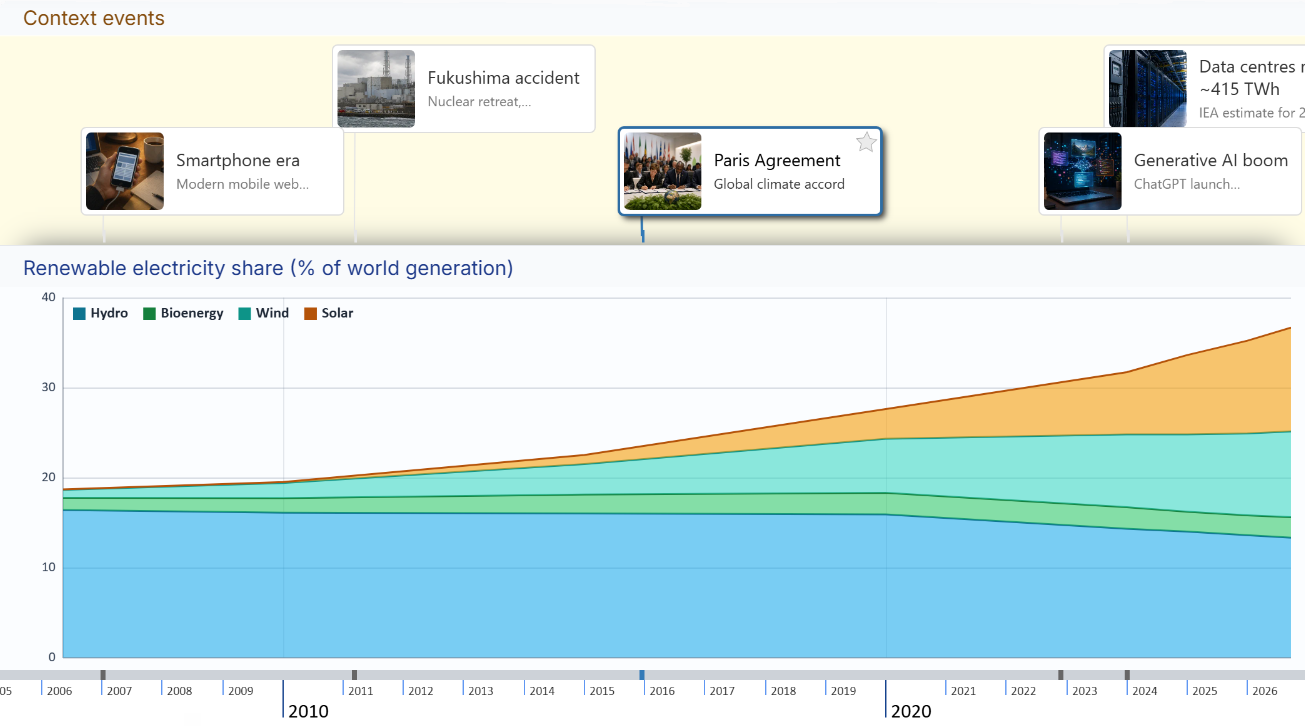
HistropediaJS 1.5.0, released 14 July 2026, brings quantitative data and historical events together on the same interactive timeline. New line and stacked-area charts use the timeline’s date scale, including inside individual lanes, so values stay aligned with their historical context as users pan and zoom.
The release also gives you more control over timeline navigation and configuration. You can constrain the viewport to a meaningful date range, use clearer string-based option values, and take advantage of a more capable navigation API.
Here are the changes worth trying first, with examples you can adapt for your own timelines.
Plot data alongside events with timeline charts
Charts let you place quantitative data in its historical context without building and synchronising a separate visualisation. Each chart follows the timeline’s horizontal date scale and has its own configurable y-scale. You can draw line or stacked-area charts, add multiple series, leave intentional gaps with null values, and control grid lines, legends, points, colours, and fills.
Load initial charts through options.chart.data:
import { Timeline } from 'histropediajs';

const timeline = new Timeline(container, {
  chart: {
    data: [
      {
        id: 'world-population',
        title: 'World population (billions)',
        type: 'line',
        scale: {
          source: 'data',
          includeZero: true,
          tickTarget: 5,
        },
        series: [
          {
            id: 'population',
            title: 'Population',
            points: [
              { date: { year: 1990 }, value: 5.3 },
              { date: { year: 2000 }, value: 6.1 },
              { date: { year: 2010 }, value: 6.9 },
              { date: { year: 2020 }, value: 7.8 },
            ],
            style: { color: '#0e7490' },
          },
        ],
        style: {
          legend: { visible: true },
          series: { lineWidth: 2, point: { visible: true, radius: 3 } },
        },
      },
    ],
  },
});
You can also load and manage charts after initialisation:
timeline.loadCharts(moreCharts);
timeline.loadLaneCharts('metrics', chartsForTheMetricsLane);

const chart = timeline.getChartById('world-population');
chart.setOption('scale.source', 'viewport');
chart.setStyle('series.lineWidth', 3);

timeline.removeChart('world-population');
// Or remove every chart:
timeline.clearCharts();
Set a chart’s lane property or use loadLaneCharts(...) to render it inside a lane body. This makes it straightforward to align independent metrics with a lane of contextual events while keeping every layer in sync during pan and zoom.
For a smaller, forkable starting point, try the Timeline Charts demo on CodePen. The full Charts example demonstrates stacked areas, multiple lane-scoped charts, forecast styling, data gaps, viewport-based y-scales, and runtime controls. See the Charts documentation for the full schema, styling model, and API.
Keep exploration inside a meaningful date range
New options.bounds settings constrain the visible viewport. minDate controls the earliest allowed left edge, while maxDate controls the latest allowed right edge. Either side can remain open by setting it to null.
const timeline = new Timeline(container, {
  bounds: {
    minDate: { year: 1950 },
    maxDate: { year: 2010, month: 12, day: 31 },
    overflow: 'elastic',
  },
});
Use overflow: 'elastic' to let a user pull briefly beyond a boundary before the timeline settles back, or use 'clamp' to stop at the edge immediately. Programmatic navigation, viewport dragging, momentum, mouse-wheel zoom, and pinch zoom all respect the configured range.
Try bounded and unbounded edges, plus both overflow modes, in the Date Bounds example.
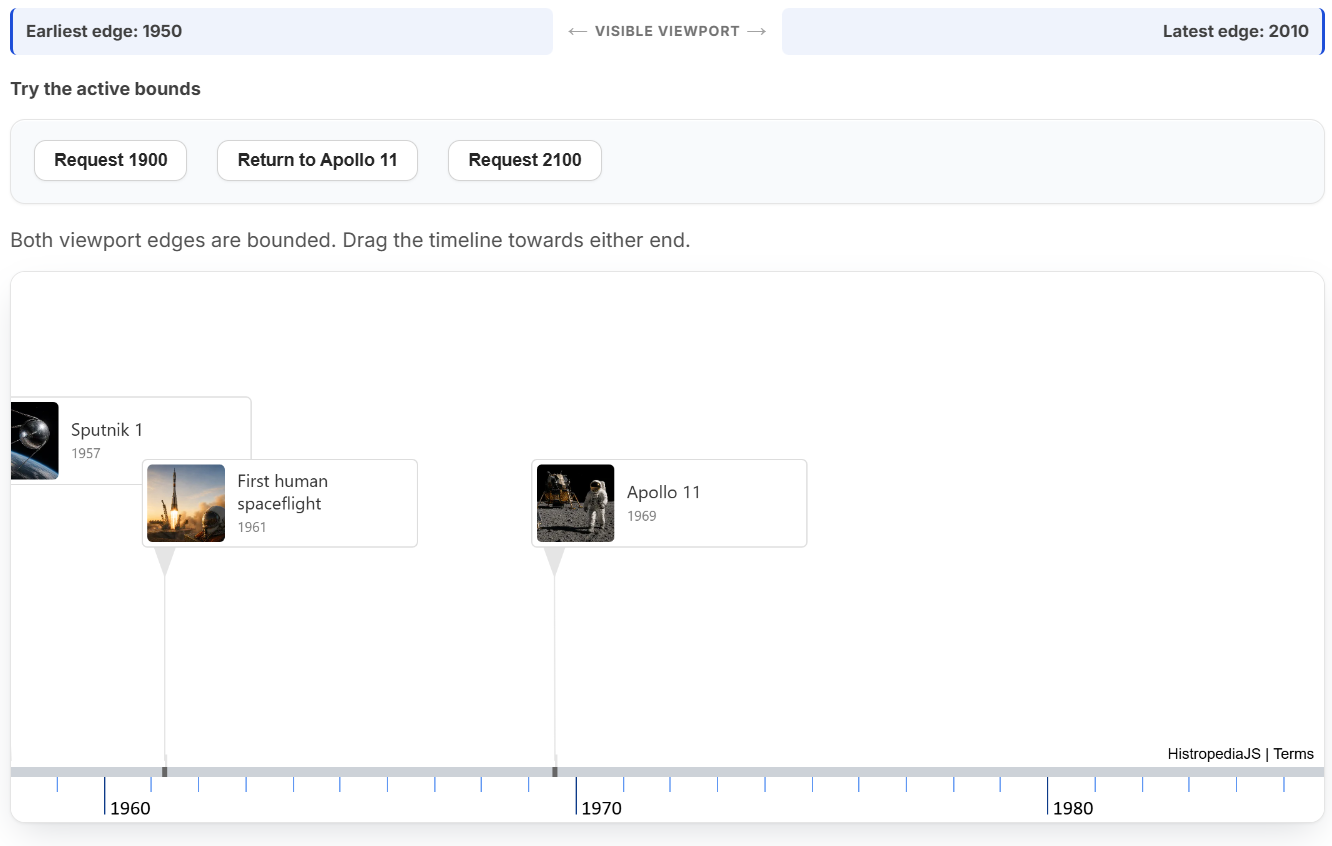
You can also update the bounds at runtime. If the current viewport might already fall outside the new range, settle it immediately to avoid it jumping to the allowed range on the next user interaction:
timeline.setOption({
  bounds: {
    minDate: { year: 1960 },
    maxDate: { year: 2000 },
    overflow: 'clamp',
  },
});

timeline.settleDateBounds({ animate: false });
Use one navigation API for jumps and animation
timeline.setStartDate(date, options) can now position a date with left padding and optionally animate the move. It accepts date strings, Histropedia.Dmy instances, and plain { year, month?, day? } objects.
timeline.setStartDate({ year: 1988 }, {
  padding: 80,
  animation: {
    active: true,
    duration: 500,
    easing: 'swing',
    complete: () => console.log('Navigation complete'),
  },
});
Missing month and day values default to 1, and the supplied object is no longer mutated during normalisation or BCE shifting.
This replaces the legacy timeline.goToDateAnim(...) method. The older numeric second argument to setStartDate(date, pixelOffset) also remains compatible, but now logs a deprecation warning. New code should pass { padding: pixelOffset } instead. The Timeline Navigation example shows this alongside the date- and article-fitting APIs.
Prefer readable strings to numeric selectors
Date precision, article density, and auto-stacking range values now use descriptive strings throughout the public options and defaults:
const timeline = new Timeline(container, {
  article: {
    density: 'medium',
    autoStacking: { range: 'screen' },
    defaultData: {
      from: { precision: 'year' },
    },
  },
});
The exported DENSITY_*, RANGE_*, and PRECISION_* constants now contain these string values too. Existing numeric values remain supported for backwards compatibility, but are deprecated.
For new code, use descriptive values directly—for example, 'medium' for density, 'screen' for stacking range, or 'year' for date precision. Precision values extend from 'day', 'month', and 'year' through larger scales such as 'decade', 'century', 'millennium', 'million-years', and 'billion-years'.
Save state after an interaction settles
The timeline-state-change event now fires after meaningful interactions complete instead of on every movement frame. Completed viewport drags, zoom gestures, animations, and article drags each produce one settled notification, making the event a much better place for persistence work.
timeline.on('timeline-state-change', (stateJson) => {
  localStorage.setItem('timeline-state', stateJson);
});
Removing an article with timeline.removeArticleById(...) now emits the same notification when an article was actually removed. One save handler can therefore cover interactive edits and removals without repeating expensive serialisation or network requests throughout an animation.
See the boundaries used for article density
Article density controls how many articles are displayed when events become crowded together on the timeline. Articles within each density region compete by rank, with higher-ranked articles remaining visible as the density level is reduced.
You can now see the region boundaries used in article-density filtering by enabling the overlay in the timeline options:
const timeline = new Timeline(container, {
  article: { density: 'medium' },
  debugOverlays: {
    densityRegions: true,
  },
});

// Toggle the guides later.
timeline.setOption('debugOverlays.densityRegions', false);
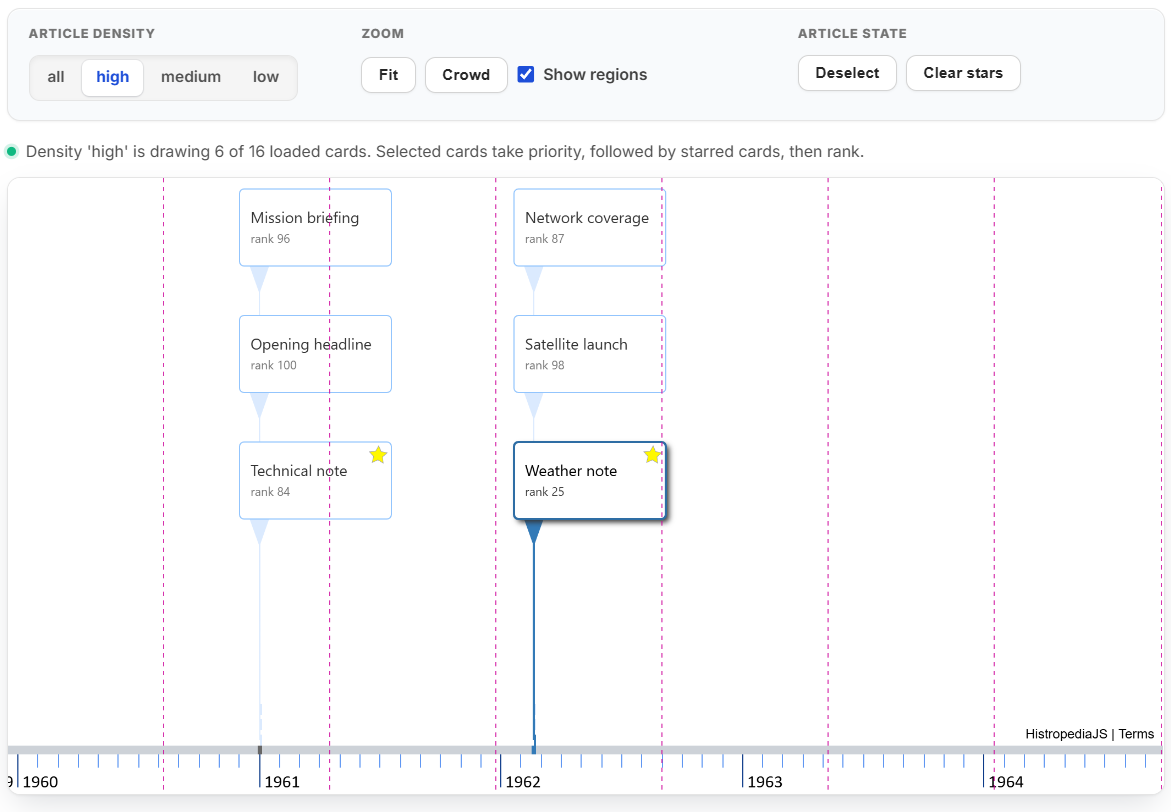
The vertical guides are visual only: they do not affect filtering, stacking, pointer input, selection, or saved timeline state. They are also independent from the global logging mode controlled by Histropedia.setDebug(). You can experiment with the overlay in the Article Density example.
Interaction and rendering fixes
v1.5.0 also includes several fixes that make navigation feel more consistent:
- Short, day-level
fitDateRange(...)animations now preserve fractional day spans, keeping intermediate zoom frames smooth. - Notched mouse wheels are detected correctly when browser zoom scales their delta values, so discrete wheel animation still runs.
- Articles are restacked when a discrete wheel animation settles, preventing overlaps after a single wheel step.
- Plain date objects are normalised without mutating caller-owned data, including when BCE shifting is enabled.
Upgrade checklist
There are no immediate removals in this release, but new code should adopt these updated forms:
- Replace numeric precision, density, and stacking-range selectors with descriptive strings.
- Replace
goToDateAnim(...)withsetStartDate(..., { animation: { active: true } }). - Replace
setStartDate(date, pixelOffset)withsetStartDate(date, { padding: pixelOffset }).
For a quick tour of v1.5.0, start with the Charts and Date Bounds examples.